Best SQL Server Monitoring Software for SQL Server

Database administrators (Database Administrator) monitor the SQL server instantly and ensure the continuity of server security and performance. They need to be able to reach a solution quickly and effectively in any problem that may occur. As DCP Teknoloji, we monitor the databases of our customers, to which we provide data processing consultancy, with advanced monitoring software.
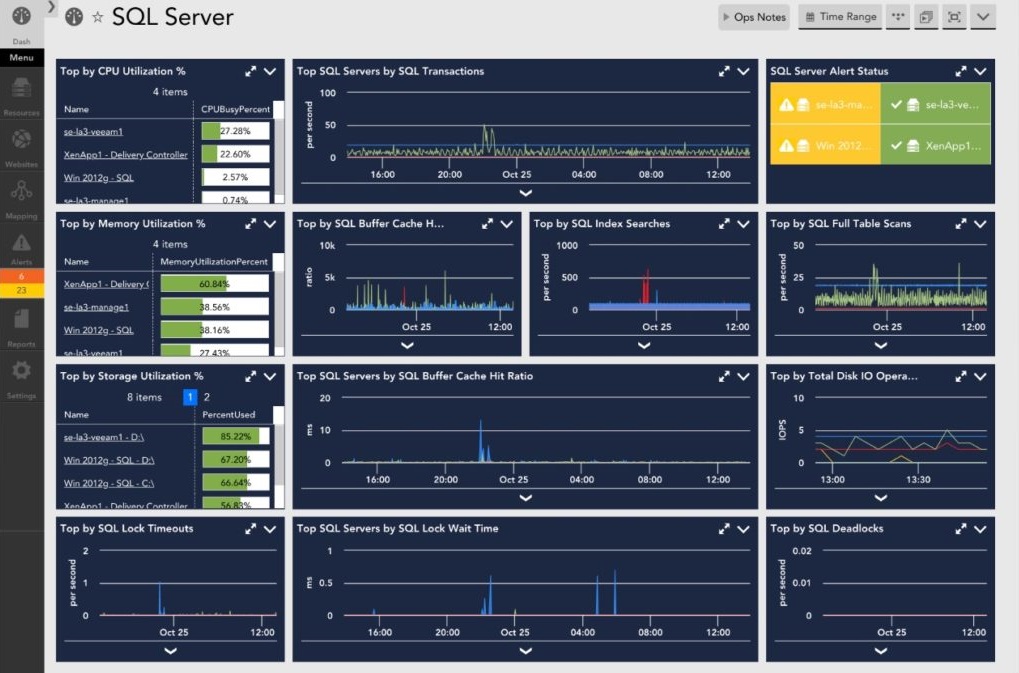
The task of these monitoring tools is to inform us about the status of the database, server and SQL. By monitoring, we can view the instant or historical status of our SQL server in detail. To these; We can give examples of disk capacity occupancy, which Query(s) work with less performance or deadlocks that occur. For such reasons, we need to choose the best SQL server monitoring tools so that we can monitor our SQL Server and quickly deal with it if there is a problem. We list the 20 best SQL server monitoring software for you that you can consider installing.
First of all, let’s start by examining the monitoring tools that come with Microsoft and SQL Server. Microsoft SQL Server comes with a suite of comprehensive tools for monitoring SQL server snapshots and designing and tuning the physical database. The choice of tools to be used depends on the type of monitoring and adjustments to be made. Below you can find the tools used in SQL Server monitoring and tuning with their descriptions.
| Vehicle | Explanation |
| sp_trace_setfilter (Transact-SQL) | SQL Server Profiler is a helpful tool that instantly reports to you the transactions, deadlocks, fatal errors, connected users, incoming requests in the server and the connected database. You can print SQL Server Profiler data to a database table or move it to another file for later analysis. You can also watch the recorded activities step by step to understand exactly what happened in the past. |
| Microsft SQL Server Distributed Replay | Distributed Replay works using trace data collected by SQL Server Profiler. With this tool, load testing can be done on SQL server. You can run any number of machines simultaneously to perform load tests with the collected trace data and analyze the results. |
| Monitor Resource Usage (System Monitor) | System Monitor is a tool primarily used to monitor resource usage. By using predefined objects and counters, you can create alarms to inform operators at warning points, access data on memory usage, CPU usage, and which active process consumes how much resources. |
| Open Activity Monitor (SQL Server Management Studio) | With this tool in SQL Server Management Studio, you can monitor SQL Server transactions and how these transactions affect the server. It graphically shows the time spent by the CPU to process data, the number of pending tasks, batch requests to the database, the load of the database on the network (MB/S) in percentile. |
| Live Query Statistics | Shows real-time statistics about the query’s run steps. Because this data is available while the query is running, these statistics are extremely useful in resolving query-related performance issues. |
| SQL Trace | With this tool offered by Microsoft Server SQL, instead of using SQL Server Profiler, you can manually search for the causes of slowdown and poor performance in the system. Information such as CPU performance developing in the interval from a desired time to a desired time, time and number information in parse-execute-fetch operations, SQL performance can be monitored. |
| Error Logs | With the event log, which is a Windows application, you can view the errors and events that occur in Windows Server and Windows operating system, as well as the events that occur in SQL Server and database agents, and use them to solve the errors. |
| System Stored Procedures (Transact-SQL) | Many administrative and informative activities can be done using the System Stored Procedures that come in SQL Server 2017. System Stored Procedures consists of the following tools. |
| DBCC (Transact-SQL) | DBCC(Database Console Command) reports allow you to check performance statistics and the logical, physical consistency of a database. |
| Built-in Functions (Transact-SQL) | The built-in functions display snapshot statistics about SQL Server activities after the server is started. These statistics are kept in predefined SQL Server performance counters. For example; @@CPU_BUSY contains the time the CPU has run the SQL Server code. @@ CONNECTIONS contains SQL Server connections and number of connections attempted. @@PACKET_ERRORS contains the number of network packets that occur on server connections. |
| Trace Flags (Transact-SQL | Trace Flags displays information about a specific activity within the server and is used to diagnose performance issues (deadlock chains, etc.). |
| Database Engine Tuning Advisor | Database Engine Tuning Advisor analyzes the performance effects of Transact-SQL operations against the databases you want to tune. |


